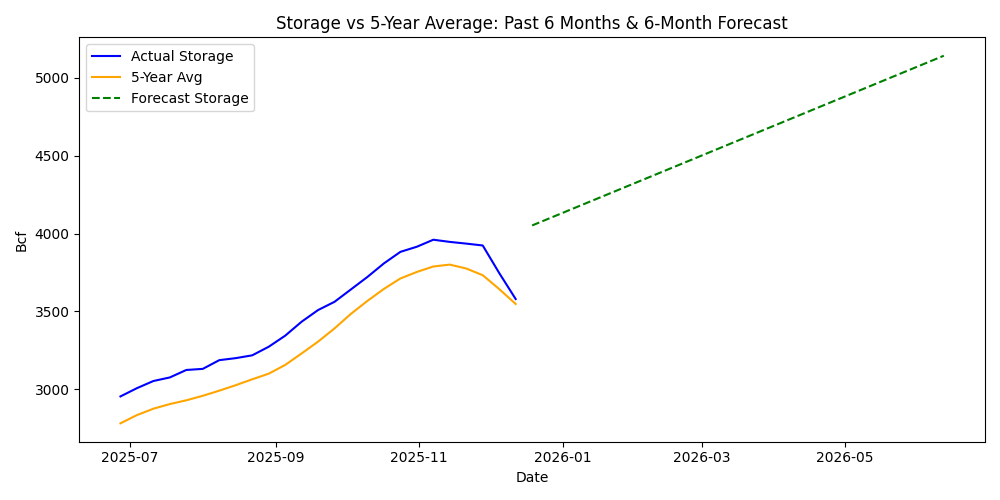
This indicator compares current natural gas storage levels with the five year average. Keeping track of whether stocks are above or below normal helps gauge supply conditions heading into winter or summer draw seasons. Over the last six months, working gas stocks have oscillated near the five‑year average, with early winter withdrawals leaving inventories modestly above seasonal norms. The chart below shows the historical diffe
differential and a six-month forecast.