Status: Yellow – Score: 5.0
The Bitcoin 200-day moving average (200DMA) is one of the simplest and most widely followed ways to define whether BTC is in a bull or bear regime. When price holds above the 200DMA, risk appetite tends to improve and pullbacks often get bought. When price breaks below and stays below, the market often shifts into defense, deleveraging, and lower liquidity conditions.
What this indicator is
This indicator compares Bitcoin’s spot price to its 200-day moving average and summarizes whether the market is trading in a bullish, neutral, or bearish trend regime.
Why it matters
Trend regime drives behavior. Bull regimes tend to reward holding and buying dips; bear regimes tend to punish leverage and favor capital preservation. Using a long-term filter like the 200DMA helps avoid reacting to short-term noise.
How to read it
- Green: Price above 200DMA and the 200DMA is rising (bull regime).
- Yellow: Price chopping around the 200DMA (transition / mixed signals).
- Red: Price below 200DMA and the 200DMA is falling (bear regime).
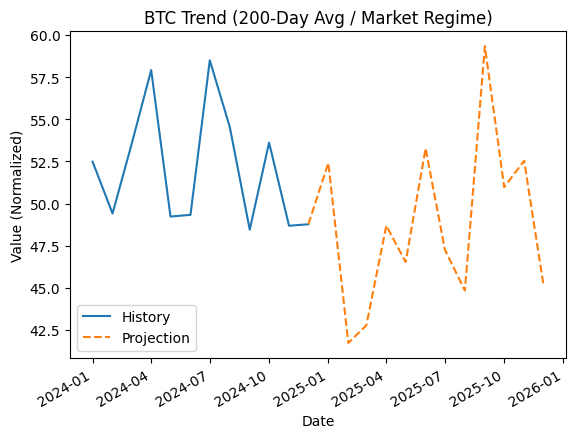
12-Month History + 12-Month Projection Chart
Note: Projection is a directional model estimate (not financial advice) and should be confirmed with other indicators.