Nasdaq vs Bitcoin
Bitcoin often trades like a high-beta risk asset during certain regimes, moving in step with equities especially tech-heavy indices like the Nasdaq. When correlation rises, macro forces (rates, liquidity, risk appetite) tend to dominate crypto. When correlation falls, crypto-specific catalysts may be driving returns.
What this indicator is
A rolling correlation measure between BTC and Nasdaq returns to gauge macro sensitivity.
Why it matters
High correlation means macro headlines can move crypto faster than crypto-native news. Lower correlation suggests crypto is trading its own cycle, which can create diversification benefits.
12-Month History + 12-Month Projection Chart
Projection is directional; confirm with liquidity and volatility indicators.
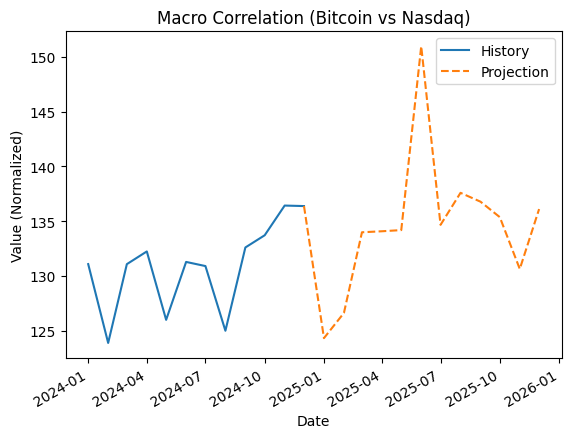
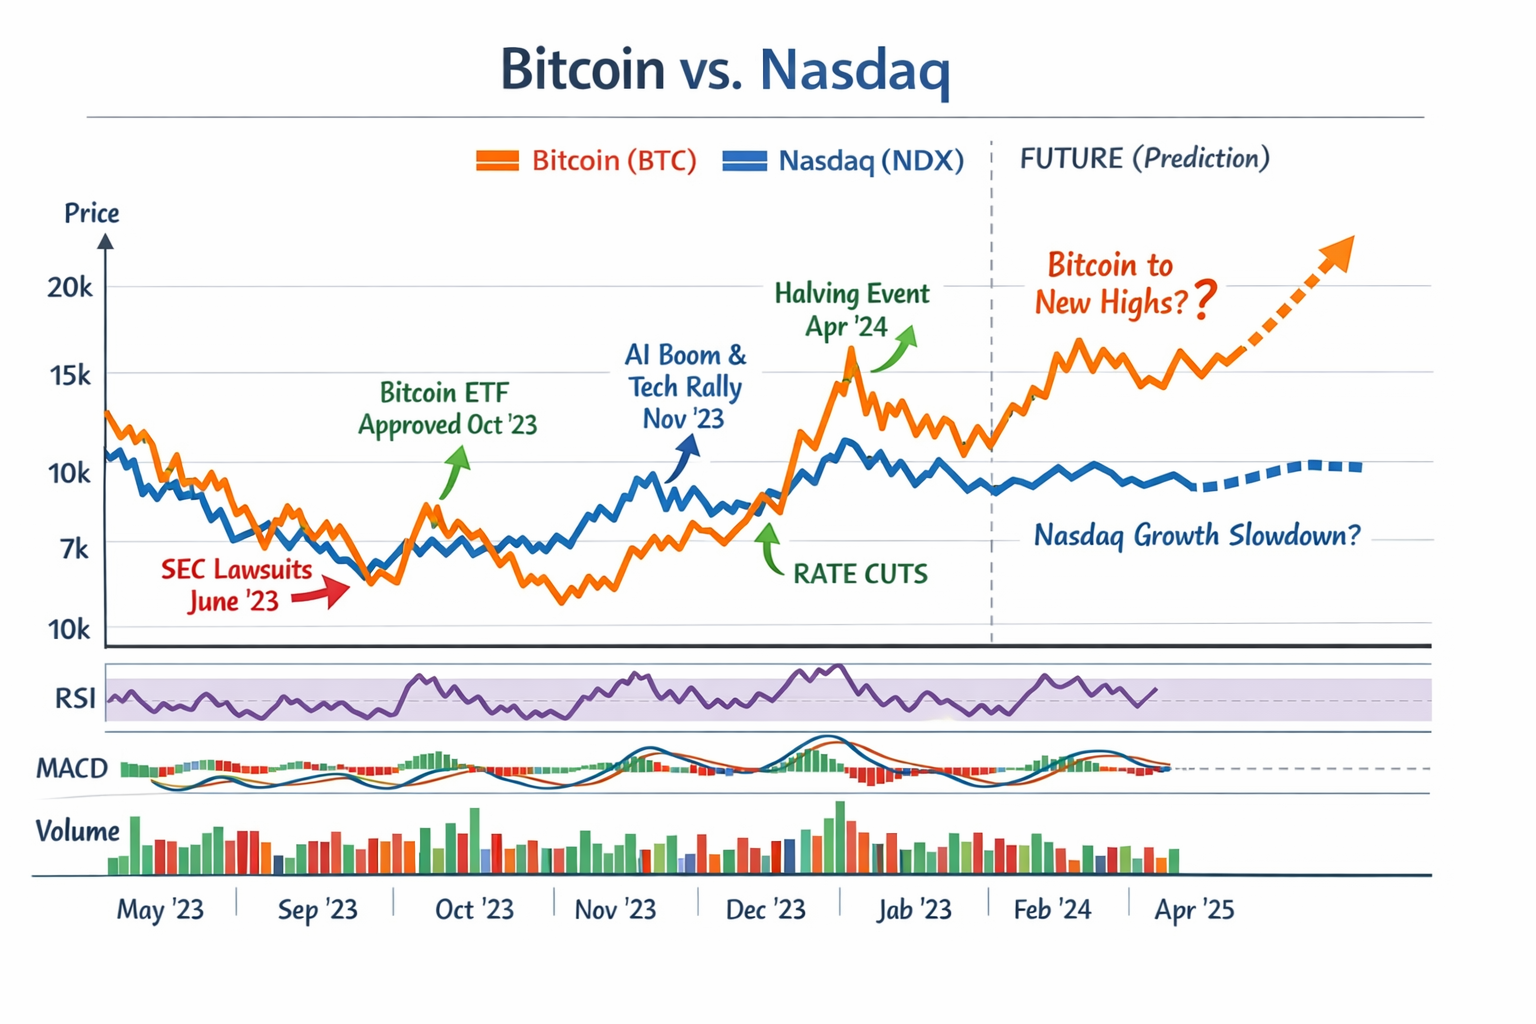
This chart above compares Bitcoin and the Nasdaq over the past 12 months while extending a forward-looking projection into the next 12 months to highlight divergence and correlation. Over the last year, both assets reacted to major macro and crypto-specific events regulatory pressure early on, followed by renewed risk appetite driven by ETF momentum, AI-led tech strength, and expectations of monetary easing. Bitcoin shows higher volatility and sharper reactions to catalysts such as ETF approval and the halving cycle, while Nasdaq trends more steadily, reflecting earnings growth and rate expectations. Technical indicators (RSI, MACD, and volume) suggest Bitcoin remains more momentum-driven, whereas Nasdaq signals a potential growth deceleration. The forward projection illustrates a scenario where Bitcoin outperforms during renewed liquidity expansion, while Nasdaq advances more gradually, reinforcing Bitcoin’s role as a high-beta risk and liquidity asset compared to traditional equities.

This comprehensive financial chart above provides a comparative analysis of Nasdaq Composite (IXIC) and Bitcoin (BTC) spanning a two-year period from December 2024 through predictions to December 2026. The main upper panel uses dual y-axes to plot historical price action up to the "Present Day" marker in December 2025, annotating significant influencing events like the Bitcoin Halving and AI sector growth. Beyond this point, it projects future performance using shaded ranges, illustrating a considerably wider, more volatile forecast for Bitcoin compared to the narrower, steadier growth predicted for the Nasdaq. Below the main price graph, two technical indicators provide deeper context: a rolling 90-day correlation chart showing fluctuating periods of co-movement between the two assets, and a 14-day Relative Strength Index (RSI) panel highlighting Bitcoin's tendency for more extreme momentum swings into overbought or oversold territory relative to the stock index.

