What it measures
This indicator tracks the share of the overall market capitalization held by the largest companies in the S&P 500. A high concentration means that a handful of mega‑cap stocks dominate the index, while low concentration implies broader market leadership. When leadership is narrow, market performance becomes heavily dependent on a few firms, increasing vulnerability to stock‑specific shocks.
Recent trend
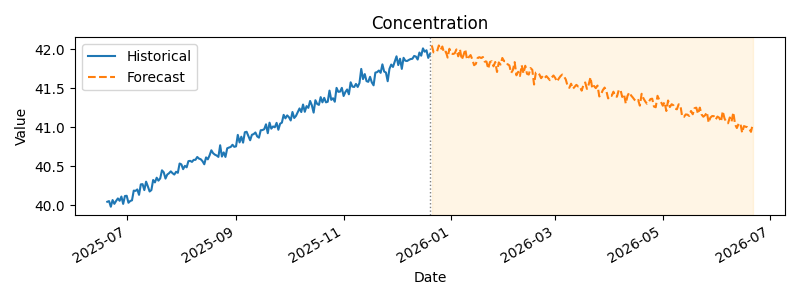
As of late 2025, the top 10 companies accounted for about 42 % of the S&P 500’s total market value, surpassing the prior peak during the dot‑com boom. Nvidia, Microsoft and Apple alone made up nearly a quarter of the index, and the combined value of the top 10 exceeded $19 trillion out of the roughly $45 trillion total market capitalization. This unprecedented concentration means almost half the market’s performance hinged on a handful of mega‑cap tech names.
Six‑month outlook
Looking ahead, concentration may ease modestly as investors rotate into undervalued sectors and earnings growth broadens. However, mega‑cap tech firms still enjoy strong cash flows and competitive advantages, so their dominance is unlikely to vanish quickly. We project the top‑10 weight to slip toward 40 % by mid‑2026, still historically high but slightly less extreme.
Signal
Red — Market leadership remains highly concentrated in a few giant tech stocks, exposing the index to greater risk if those firms stumble. Until broader participation emerges, this indicator warrants caution.