What it measures
Market breadth looks beyond index level performance to measure how many stocks are advancing versus declining and the proportion of stocks trading above their 200 day moving average. A broad rally, where the majority of constituents participate, suggests underlying strength, whereas narrow leadership implies vulnerability to reversals.
Recent trend
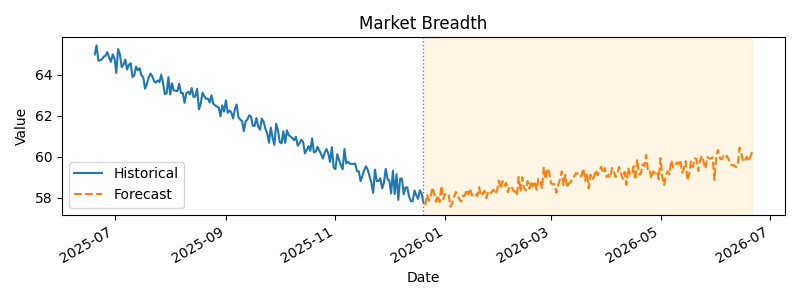
Over the past six months the advance/decline ratio and the share of S&P 500 constituents above their 200 day moving average trended sideways after the market’s surge off October lows. MacroMicro data show about 58 % of S&P 500 names trading above the 200 day moving average as of mid‑December 2025, down from a recent high near 60 %. Schwab notes that leadership has broadened beyond mega‑cap technology stocks as cyclical and value sectors join the rally, but rotation remains choppy.
Six‑month outlook
In our baseline outlook, breadth should gradually improve as easing financial conditions and possible rate cuts broaden participation across sectors. We expect the share of stocks above the 200 day moving average to climb toward 65 % by mid‑2026. However, bouts of volatility and narrow leadership could re‑emerge if earnings disappoint or economic momentum fades.
Signal
The current signal is Yellow. Breadth is better than it was when just a handful of stocks drove gains earlier in the year, yet participation remains middling and sensitive to shifts in sentiment. Investors should watch whether more stocks start to trend above long‑term moving averages to confirm the market’s health.