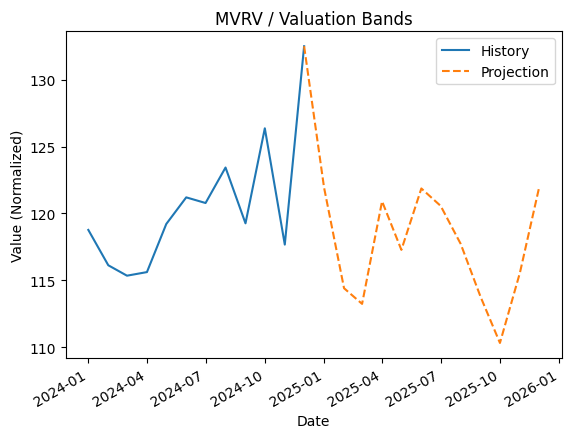
MVRV (Market Value to Realized Value) compares the current market capitalization to the “realized” value of coins based on their last moved price. High MVRV zones can indicate overextension; low zones can indicate undervaluation or capitulation conditions.
What this indicator is
A valuation framework that compares market value to realized value to highlight overbought/oversold conditions.
Why it matters
Valuation extremes often align with major cycle highs and lows. MVRV can help investors avoid chasing overheated conditions and recognize periods of long-term opportunity.
How to read it
- Green: Below/near neutral valuation bands (better long-term risk/reward).
- Yellow: Mid-band valuations (balanced conditions).
- Red: High valuation bands (overextension risk).
12-Month History + 12-Month Projection Chart
Projection is directional; combine with trend and liquidity measures before acting.