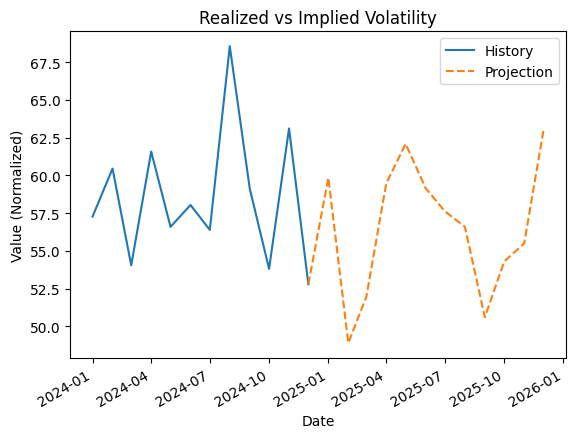
Volatility is the “price of risk” in crypto. Realized volatility measures how much BTC has actually moved, while implied volatility reflects how much movement options traders expect. When implied volatility is far above realized, options are expensive and the market is pricing fear or uncertainty. When implied is below realized, options can be underpricing risk.
What this indicator is
A comparison between recent realized volatility and options-implied volatility to gauge whether the market is complacent or stressed.
Why it matters
Large gaps can signal turning points. Elevated implied volatility can precede big moves, while unusually low implied volatility can signal complacency ahead of volatility expansion.
How to read it
- Green: Implied ≈ realized (healthy pricing, stable conditions).
- Yellow: Implied moderately above realized (caution, rising uncertainty).
- Red: Implied far above realized (stress / fear premium).
12-Month History + 12-Month Projection Chart
Projection is directional only and should be used alongside funding, flows, and trend regime.