What it measures
The yield‑curve slope is the difference between the yields on 10‑year and 2‑year U.S. Treasury notes. A positive value signals a normal curve while a negative (inverted) curve often precedes recessions. Real rates use Treasury Inflation‑Protected Securities (TIPS) to show inflation‑adjusted borrowing costs.
Recent trend
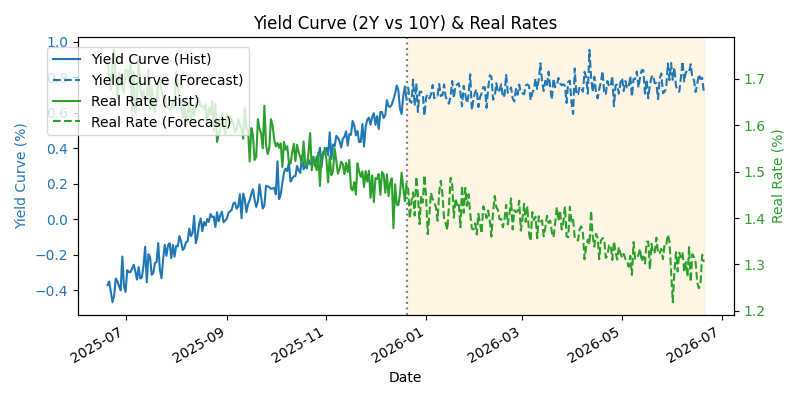
In mid‑2025 the yield curve was inverted around –0.4 percentage‑points but steepened sharply as long‑term yields rose and two‑year yields fell. By mid‑December 2025 the spread was about 0.68 percentage‑points【418447924784911†L83-L102】. Real ten‑year rates fell from roughly 1.7 % to 1.45 % over the same period【841949492600537†L83-L102】.
Six-month outlook
RBC expects the 10‑year yield to end 2026 near 4.55 %, which implies a slightly steeper curve over the next six months【518335307822202†L202-L205】. As inflation cools, real rates could drift toward 1.3 % and the slope may approach 0.8 percentage‑points.
Signal
Current signal: Yellow. The yield‑curve slope has only just turned positive and remains shallow, while real rates are still elevated; this warrants a neutral/cautious outlook.